


Bitcoin has fallen back toward $78,000 on Nov. 5 after briefly recovering above $81,000, leaving its November rebound vulnerable as buyers struggle to hold the $80,000 level.
Summary
- Bitcoin’s daily chart shows a descending channel, with resistance clustered around $80,000 to $82,000.
- Daily RSI remains below 50, while weekly money flow holds above the zero line.
- Liquidation concentrations sit near $79,000 and $80,000, with further liquidity below $76,000.
- Analysts differ on recovery prospects, with forecasts ranging from continued consolidation to a conditional $85,000 rebound.
According to Binance BTC/USDT data displayed on TradingView, Bitcoin traded at $78,000 at 15:01 UTC on Nov. 5, down 3.11% during the daily session. The accompanying weekly chart recorded a price near $77,833, following a weekly high of $81,196 and a low of $75,736.
Bitcoin faces resistance after losing $80,000
On the daily chart, Bitcoin remains inside a descending channel drawn from its late-September and early-October highs. Successive rebounds have stopped at lower levels, with the latest recovery failing before price could escape the channel’s upper boundary.
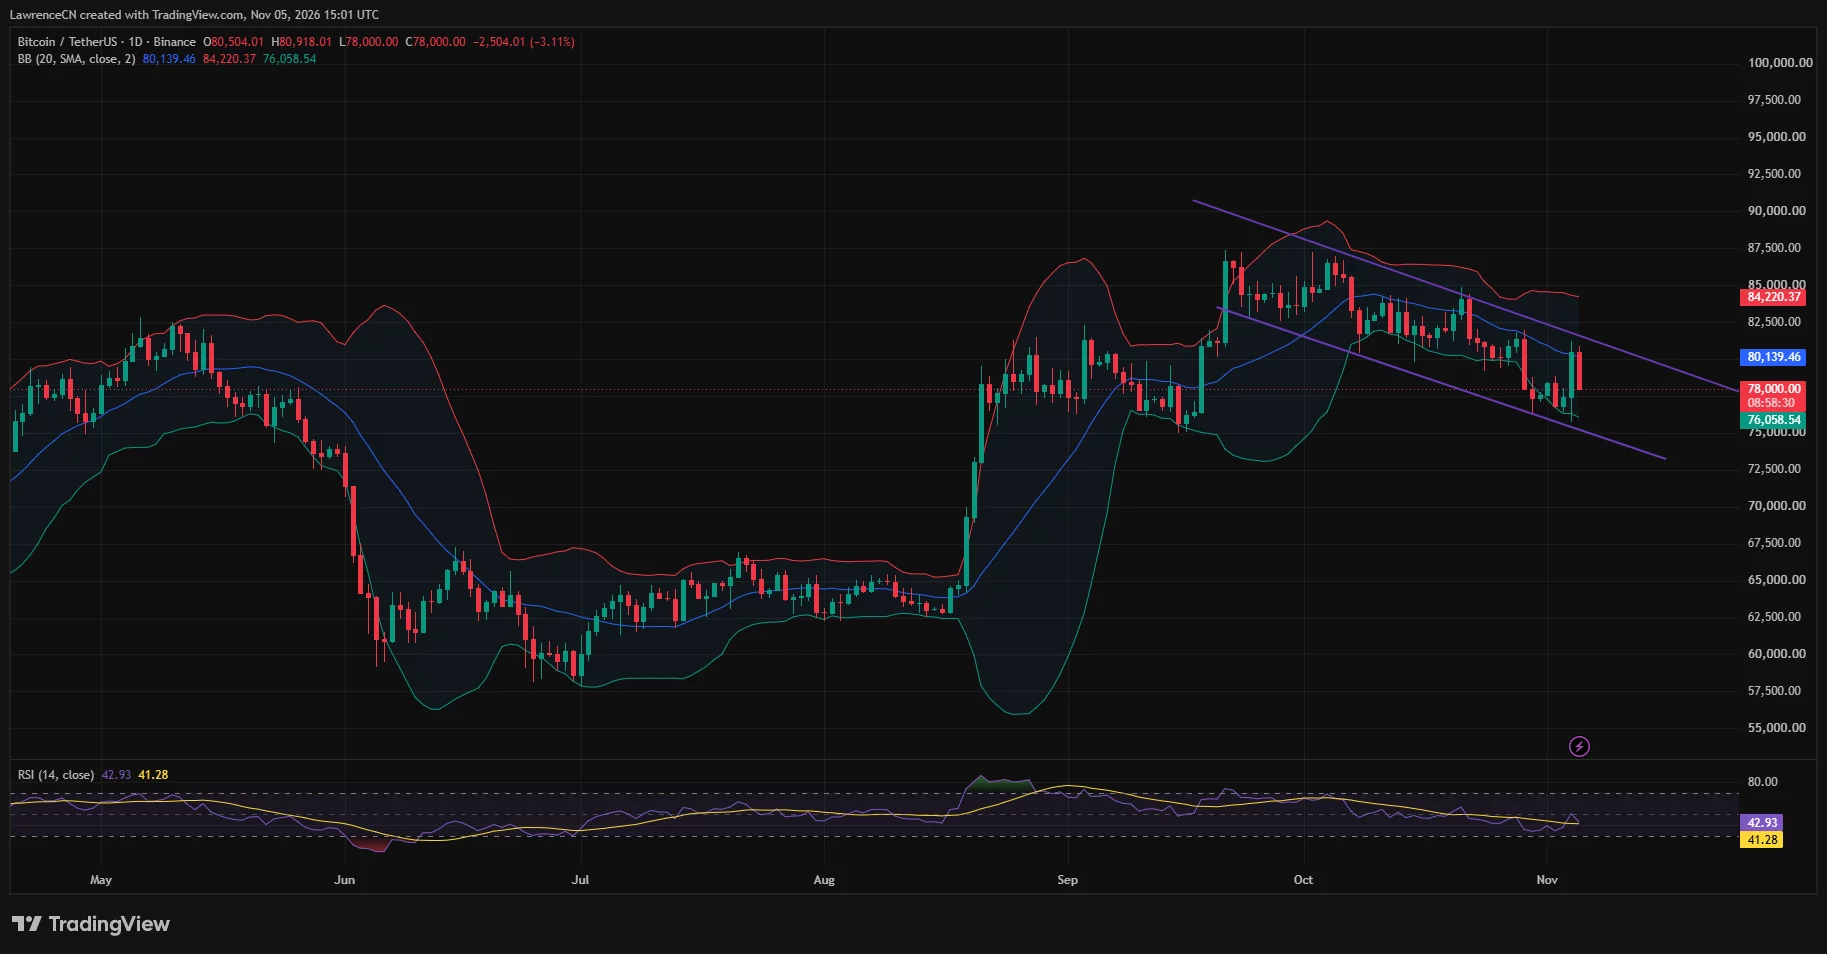
The Bollinger Bands place the 20-day moving average at $80,139, above the current price. Its upper band stands at $84,220, while the lower band sits at $76,059.
A daily close above the moving average would put Bitcoin back over an immediate technical hurdle. Clearing the channel boundary near $81,000 to $82,000 would provide stronger evidence that the sequence of lower highs is breaking.
Until then, the lower Bollinger Band and this week’s $75,736 low define the nearest downside area on the chart. A break beneath that zone would leave the channel’s declining lower boundary, approaching $73,000, exposed.
The daily Relative Strength Index stands at 42.93, below the neutral 50 level but above its displayed average of 41.28. Momentum has recovered from recent lows without establishing a sustained bullish reading.
Analysts put different conditions on a November recovery
In a Nov. 5 X post, pseudonymous analyst Altcoin Sherpa described Bitcoin’s current trading area as a “chop zone,” saying he expected several more weeks of uneven trading.
He identified $90,000 and $75,000 as the boundaries Bitcoin would need to break decisively before the market offered clearer direction. His assessment leaves room for substantial swings inside the range without treating each rebound as the start of a lasting recovery.
Merlijn The Trader outlined a more immediate bullish setup in a separate post that day. He said Bitcoin had completed a double-bottom pattern after passing a $78,500 neckline and reaching its $81,000 target.
His next targets depended on Bitcoin holding above $80,000, which he said could open a move toward $81,600 and then $85,000. The subsequent retreat below his stated support means that condition was no longer satisfied in the afternoon chart.
As crypto.news previously reported, Bitcoin had already recovered above $78,000 on Nov. 4 after an election-related selloff. U.S. spot Bitcoin ETFs recorded $115.6 million in net withdrawals on Nov. 3, taking outflows above $1.15 billion across three sessions.
Weekly indicators show a mixed picture
The weekly chart offers a less uniformly bearish reading than the daily price structure.
Chaikin Money Flow stands at 0.11, remaining above zero despite Bitcoin’s retreat. The indicator measures buying and selling pressure using price and volume, so its positive reading contrasts with the recent run of declining weekly candles.
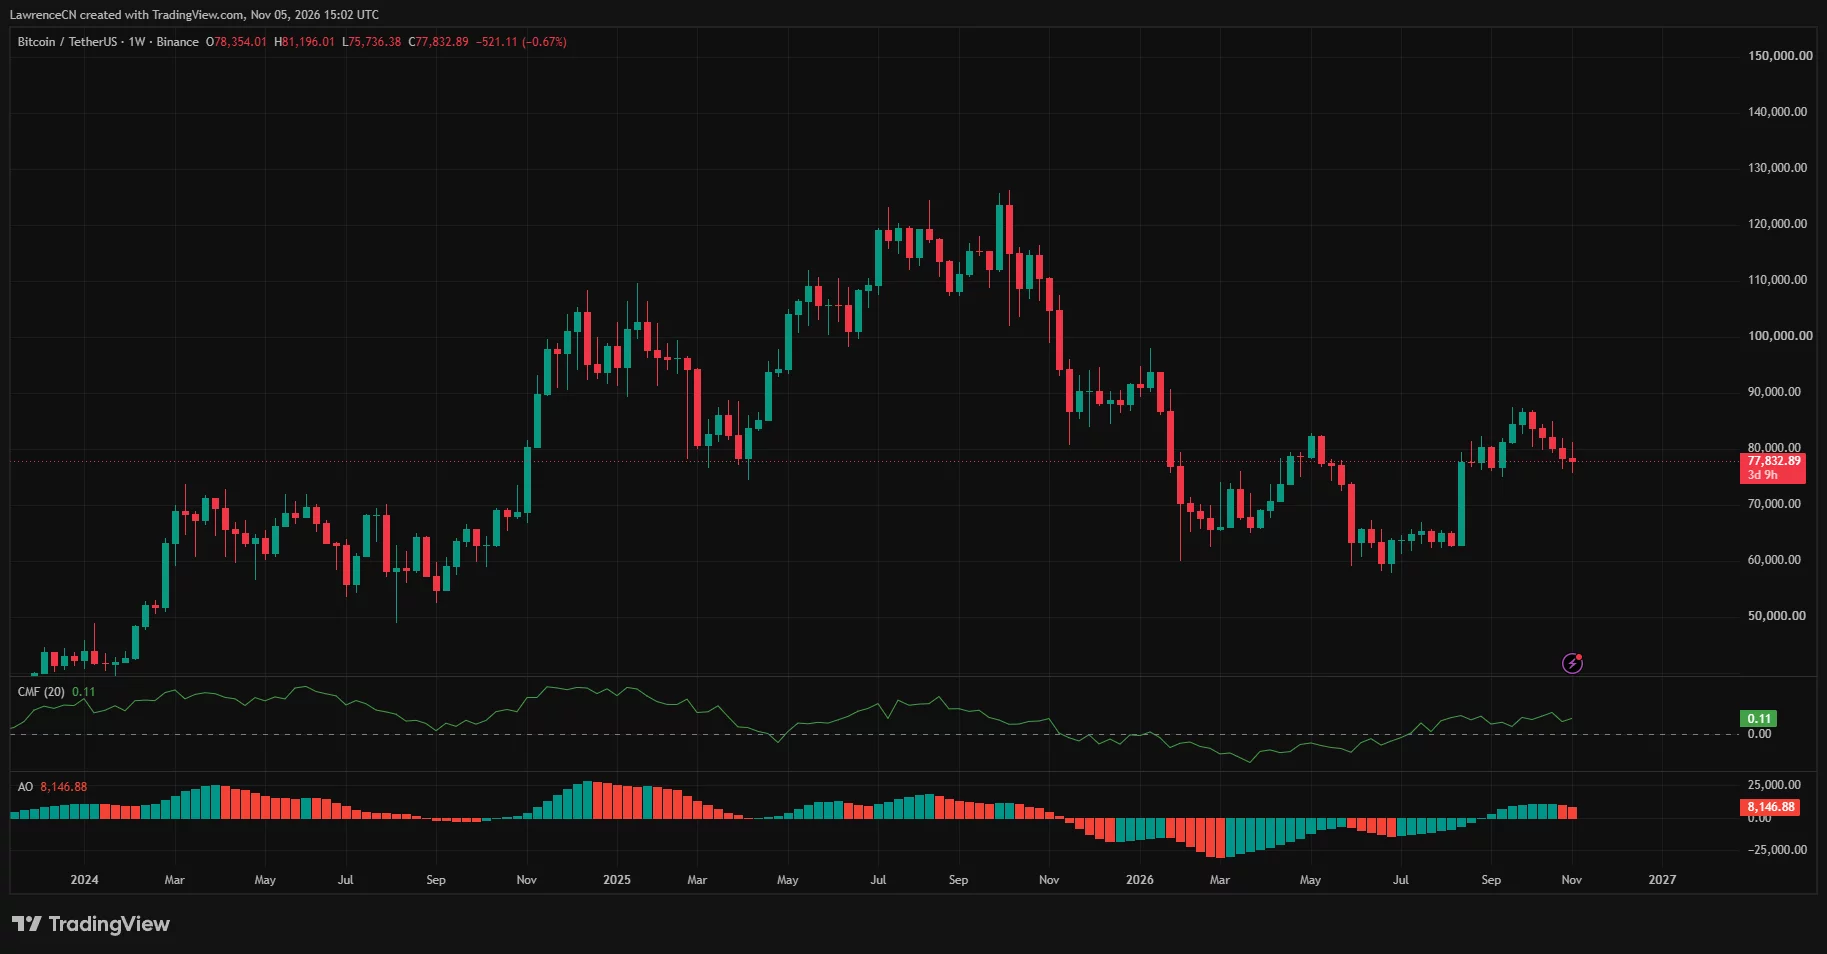
The Awesome Oscillator remains positive at 8,146.88, although its latest histogram bars are red and shorter than the preceding green bars. Positive momentum persists on this measure, but it has weakened.
Neither indicator establishes that a bottom is in place. The weekly candle was still open when the chart was captured, with more than three days remaining before completion.
Liquidation clusters surround the current trading range
CoinGlass’s one-week liquidation heatmap shows concentrations around $79,000 to $80,000 and further overhead bands near $81,500 and $82,000. Below price, visible clusters sit around $77,000 to $77,500 and $75,000 to $76,000.
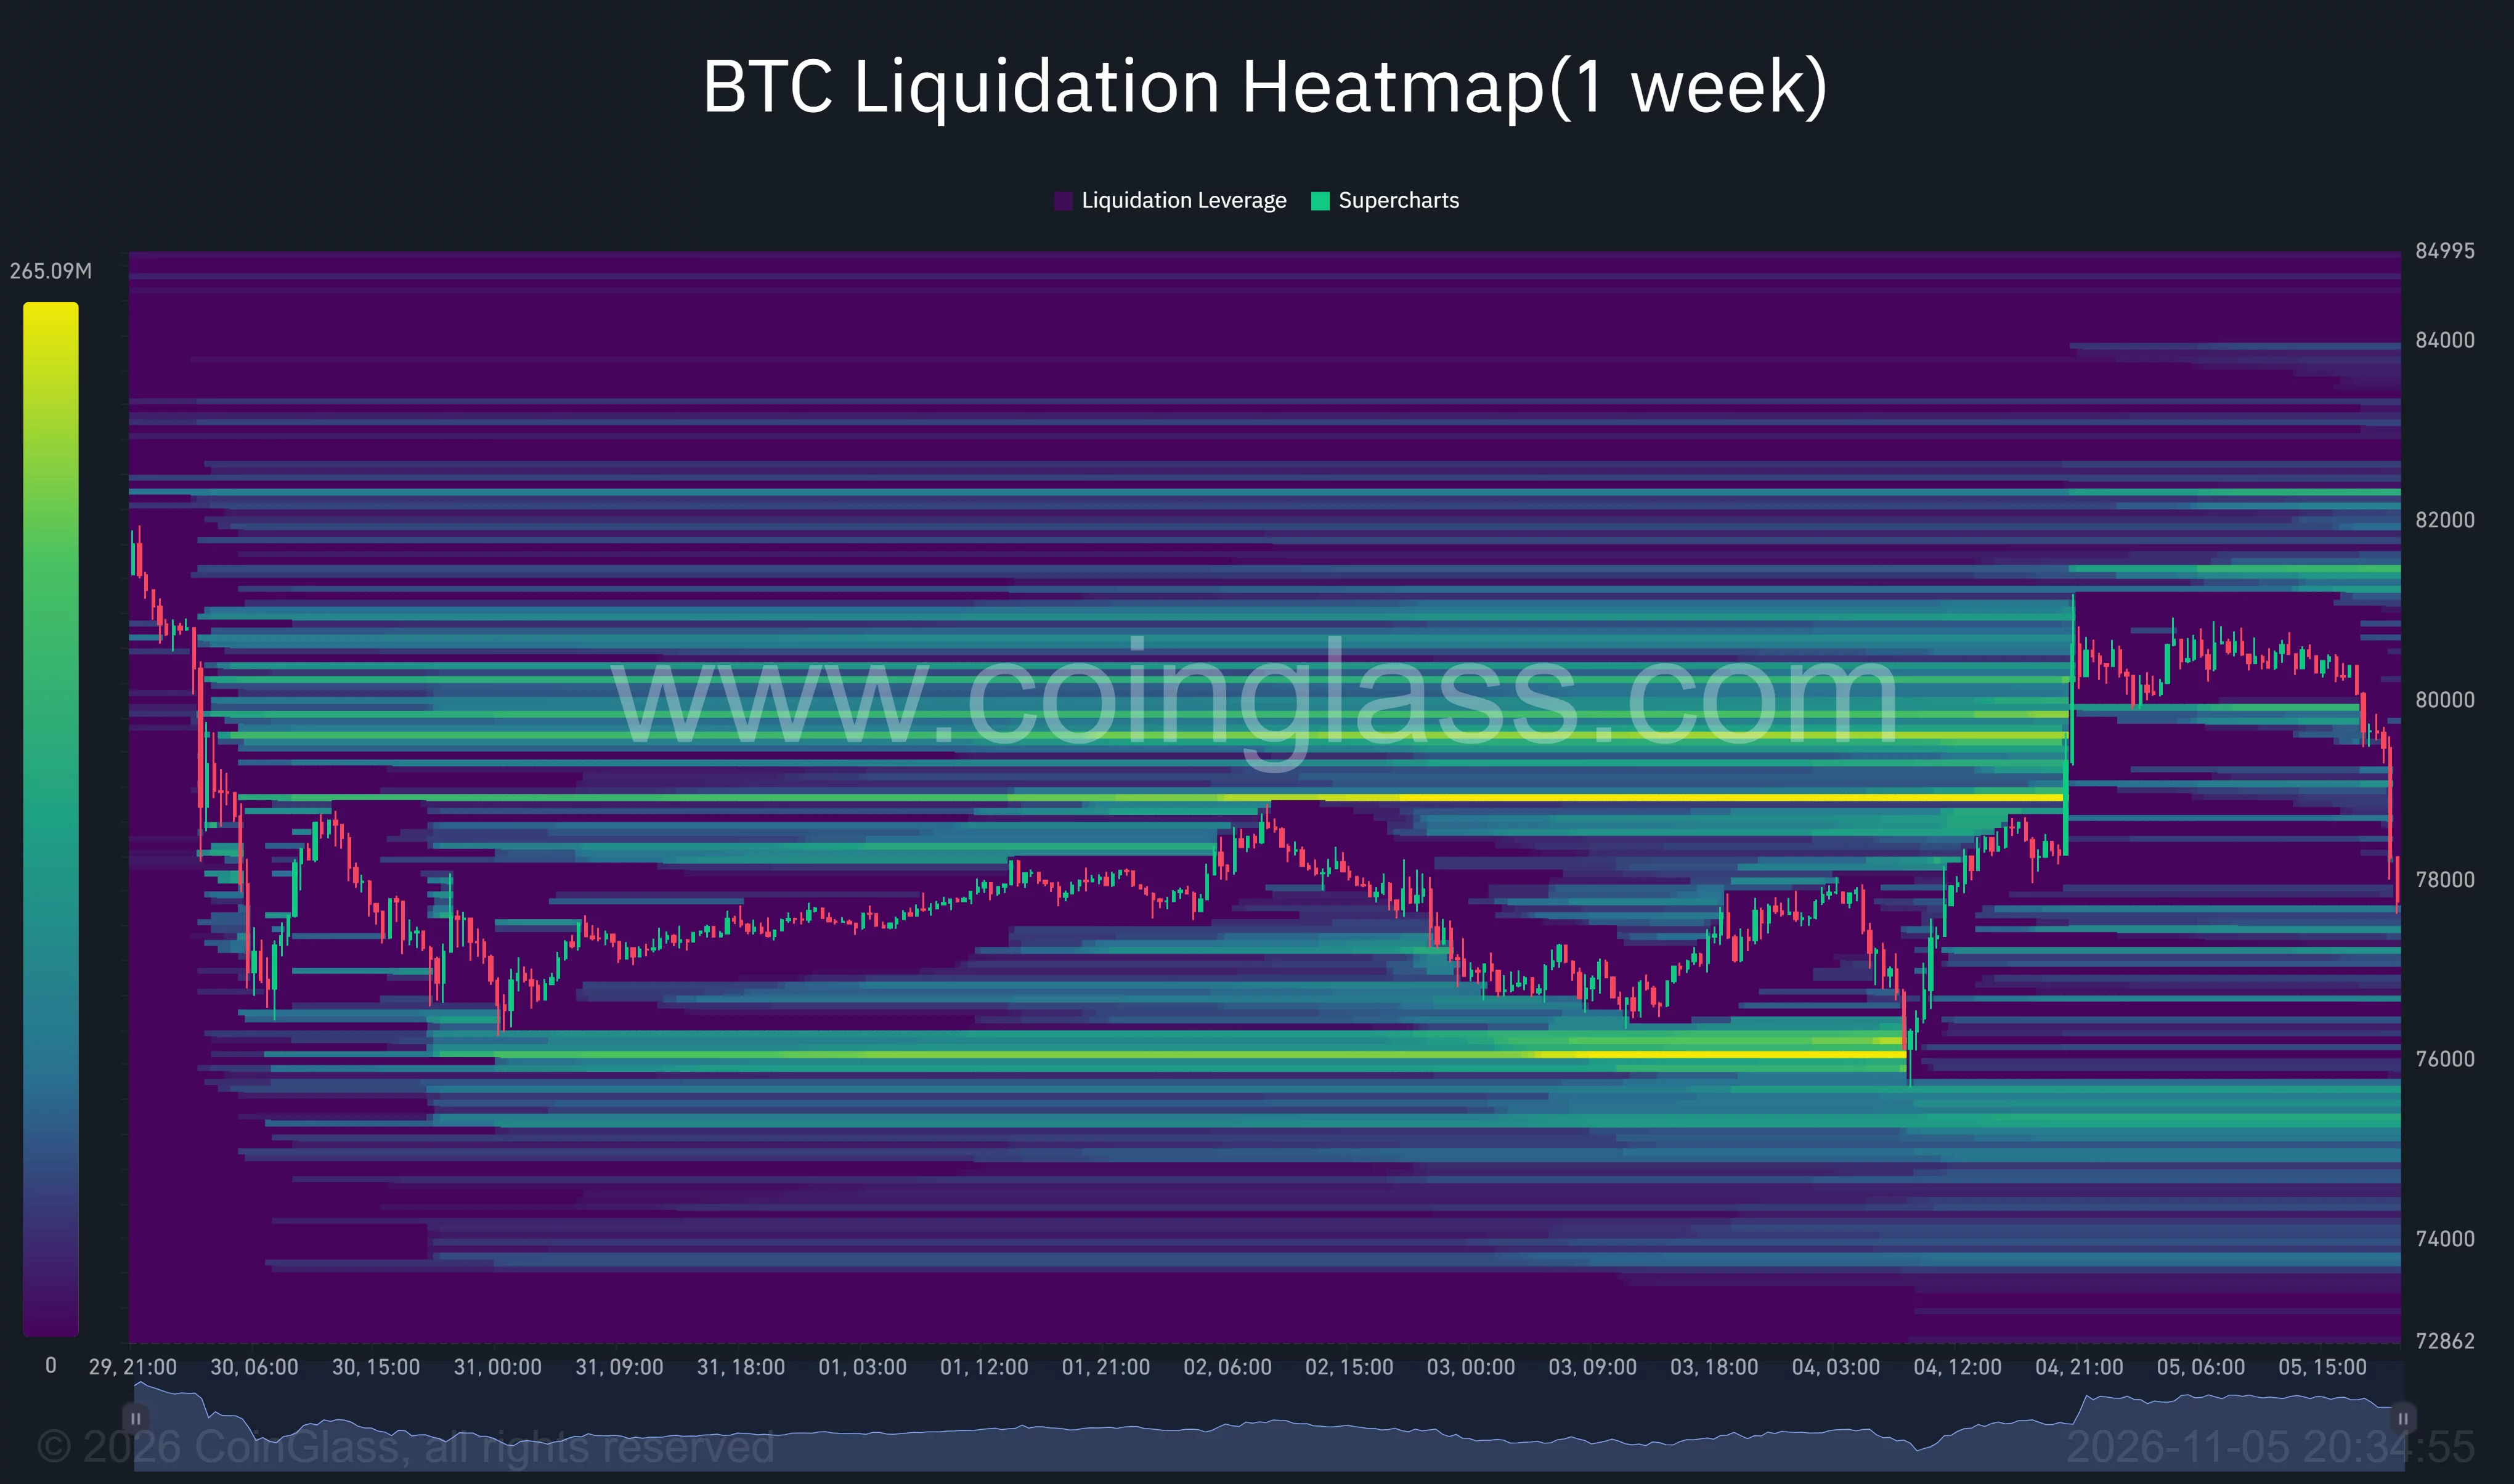
Such bands identify estimated liquidation exposure, rather than guaranteed destinations or confirmed support.
Exchange security remains part of November’s backdrop. Following the October security breach, Binance reserved replacement funds to cover affected assets.
In its Nov. 3 incident report, Binance put the impact at $6.34 billion and said approximately $2.85 billion had been frozen or intercepted. The exchange said 98% of impacted token assets had been replenished and that purchases of the remaining, less liquid assets were continuing.
Disclosure: This article does not represent investment advice. The content and materials featured on this page are for educational purposes only.
