


Ethereum price has fallen below $2,600 as escalating tensions around the Strait of Hormuz triggered a wider crypto sell-off and pushed ETH toward a key technical support zone.
Summary
- Ethereum price fell below $2,600 as geopolitical tensions triggered a broader crypto market sell-off.
- ETH is testing the key $2,500–$2,560 support zone after dropping below its 20-day moving average.
- Daily RSI has fallen to 44.55, while the 4-hour chart shows ETH trading below its lower Bollinger Band.
- Analysts say holding $2,500–$2,560 could keep a rebound toward $3,000 in play, while a breakdown may deepen the correction.
Ethereum (ETH) price traded around $2,565 at press time on Oct. 7, down roughly 5% on the daily chart after falling from an intraday high near $2,700. The decline extended ETH’s weakness after the token struggled to sustain its recent move toward $2,800.
The sell-off coincided with a sharp reversal across the broader crypto market. Bitcoin dropped from roughly $86,600 to a low near $83,060 on Oct. 7, including a decline of about $2,000 within 30 minutes.
The move followed reports of escalating attacks involving oil tankers around the Strait of Hormuz, raising concerns over disruption to a key global energy route. The resulting risk-off move also sent Brent crude toward $101.50 per barrel, while the U.S. 10-year Treasury yield climbed to around 5.31%.
Higher oil prices have renewed inflation concerns, while rising Treasury yields can reduce demand for risk assets by increasing the returns available from government debt.
Leverage added to the speed of the crypto decline. More than $400 million in leveraged long positions were liquidated during the Oct. 7 market flush, according to market data, forcing additional selling as prices moved lower.
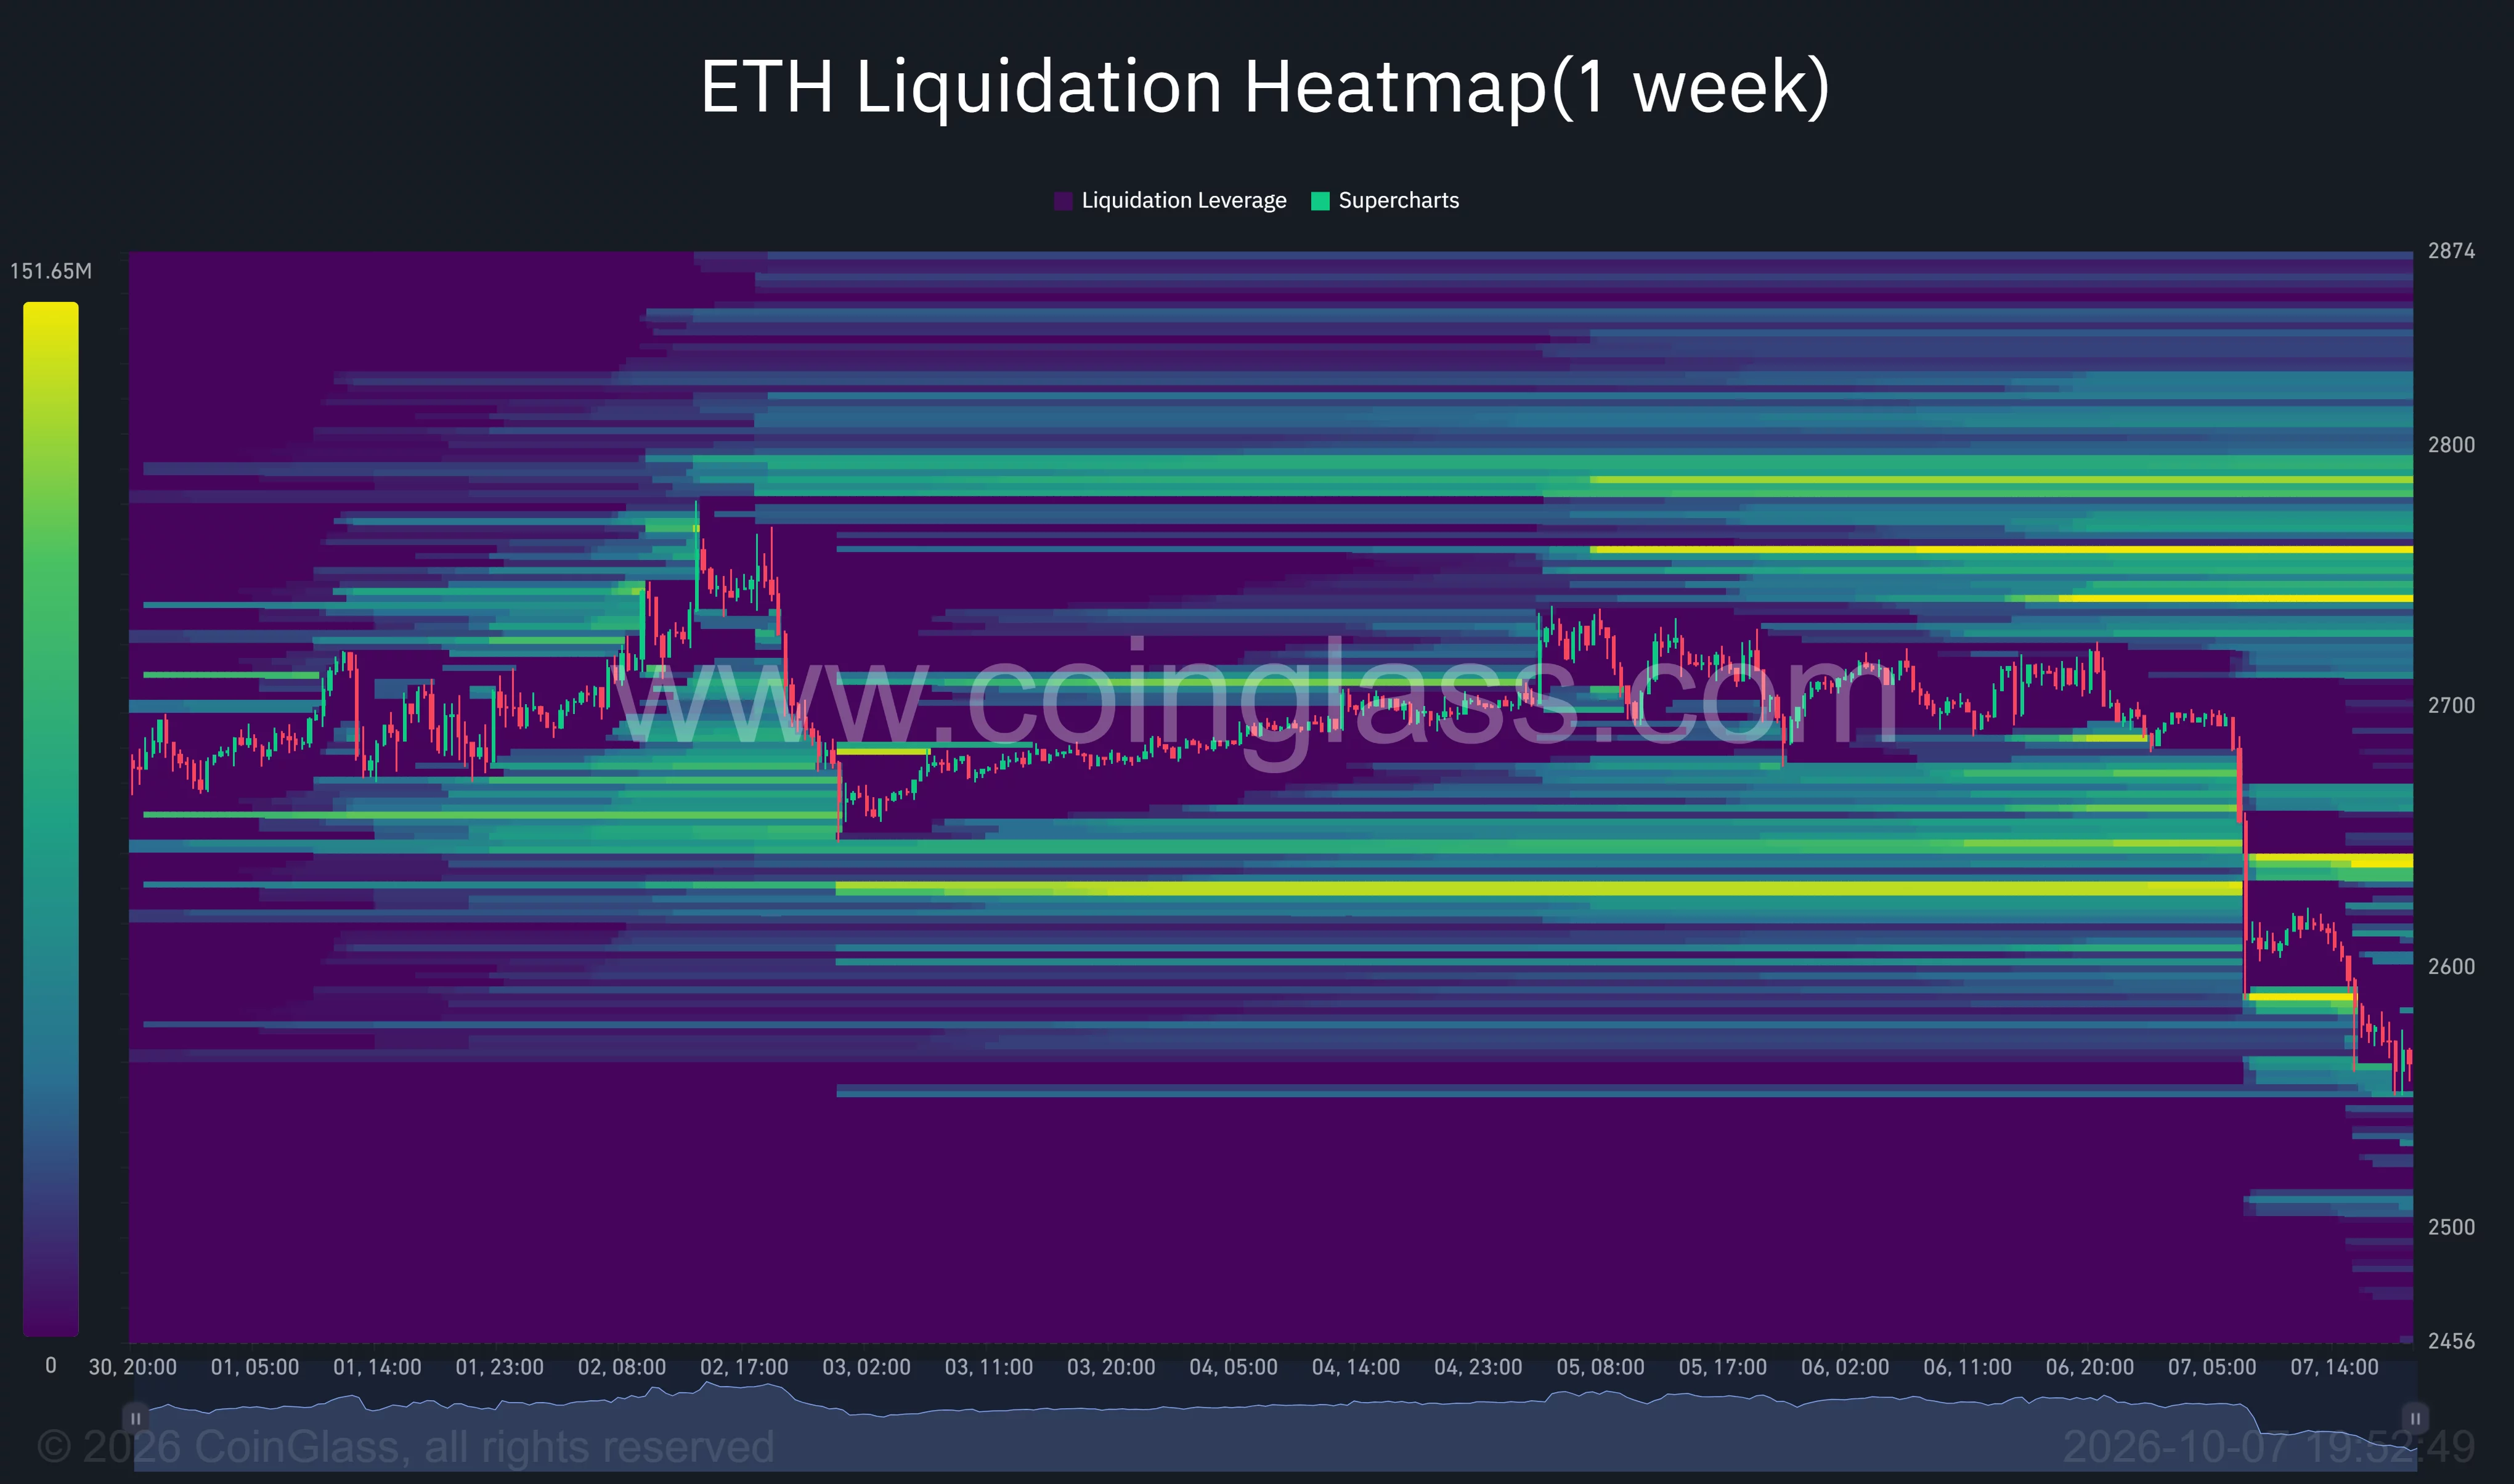
Ethereum’s one-week CoinGlass liquidation heatmap shows how the decline pushed ETH through several areas of concentrated leverage. Price has fallen from around $2,700 toward the mid-$2,500 range, with liquidity still concentrated around $2,640-$2,660 and larger clusters sitting above $2,700.
Ethereum price tests a critical support zone
Ethereum’s daily chart shows ETH falling below its 20-day simple moving average at $2,684 after failing to extend September’s rally beyond the $2,800 area.
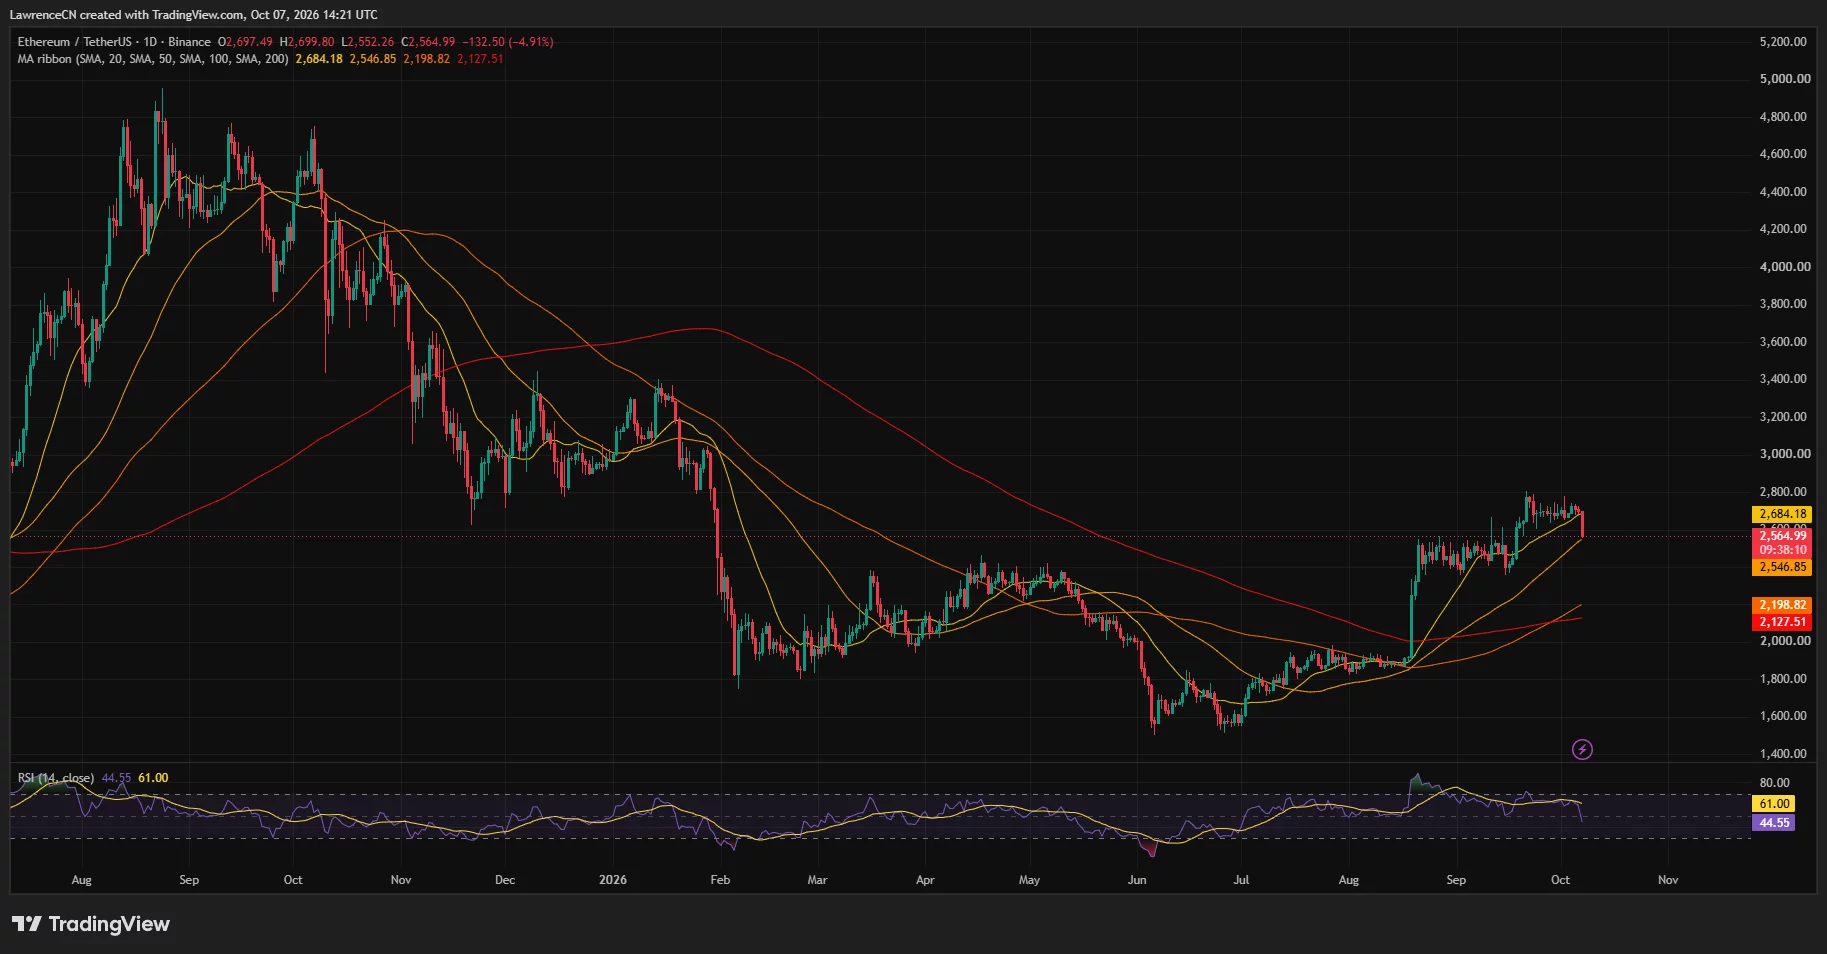
ETH remains above its longer-term moving averages, however. The 50-day SMA sits around $2,565, almost directly around the current price, while the 100-day and 200-day averages stand near $2,199 and $2,128, respectively.
The 50-day average therefore represents the first major technical test following the sell-off. Holding the $2,550-$2,565 region could allow ETH to stabilize after the sharp decline, while a decisive daily break below it would weaken the structure established during the August and September recovery.
Momentum has also deteriorated. The daily relative strength index has fallen to 44.55, below the neutral 50 level and well below its recent reading around 61. The indicator is not yet oversold, leaving room for additional downside if selling continues.
The 4-hour chart presents a similarly weak short-term picture. ETH has fallen beneath the lower Bollinger Band, which stands around $2,589, while the middle band sits substantially higher at $2,684.
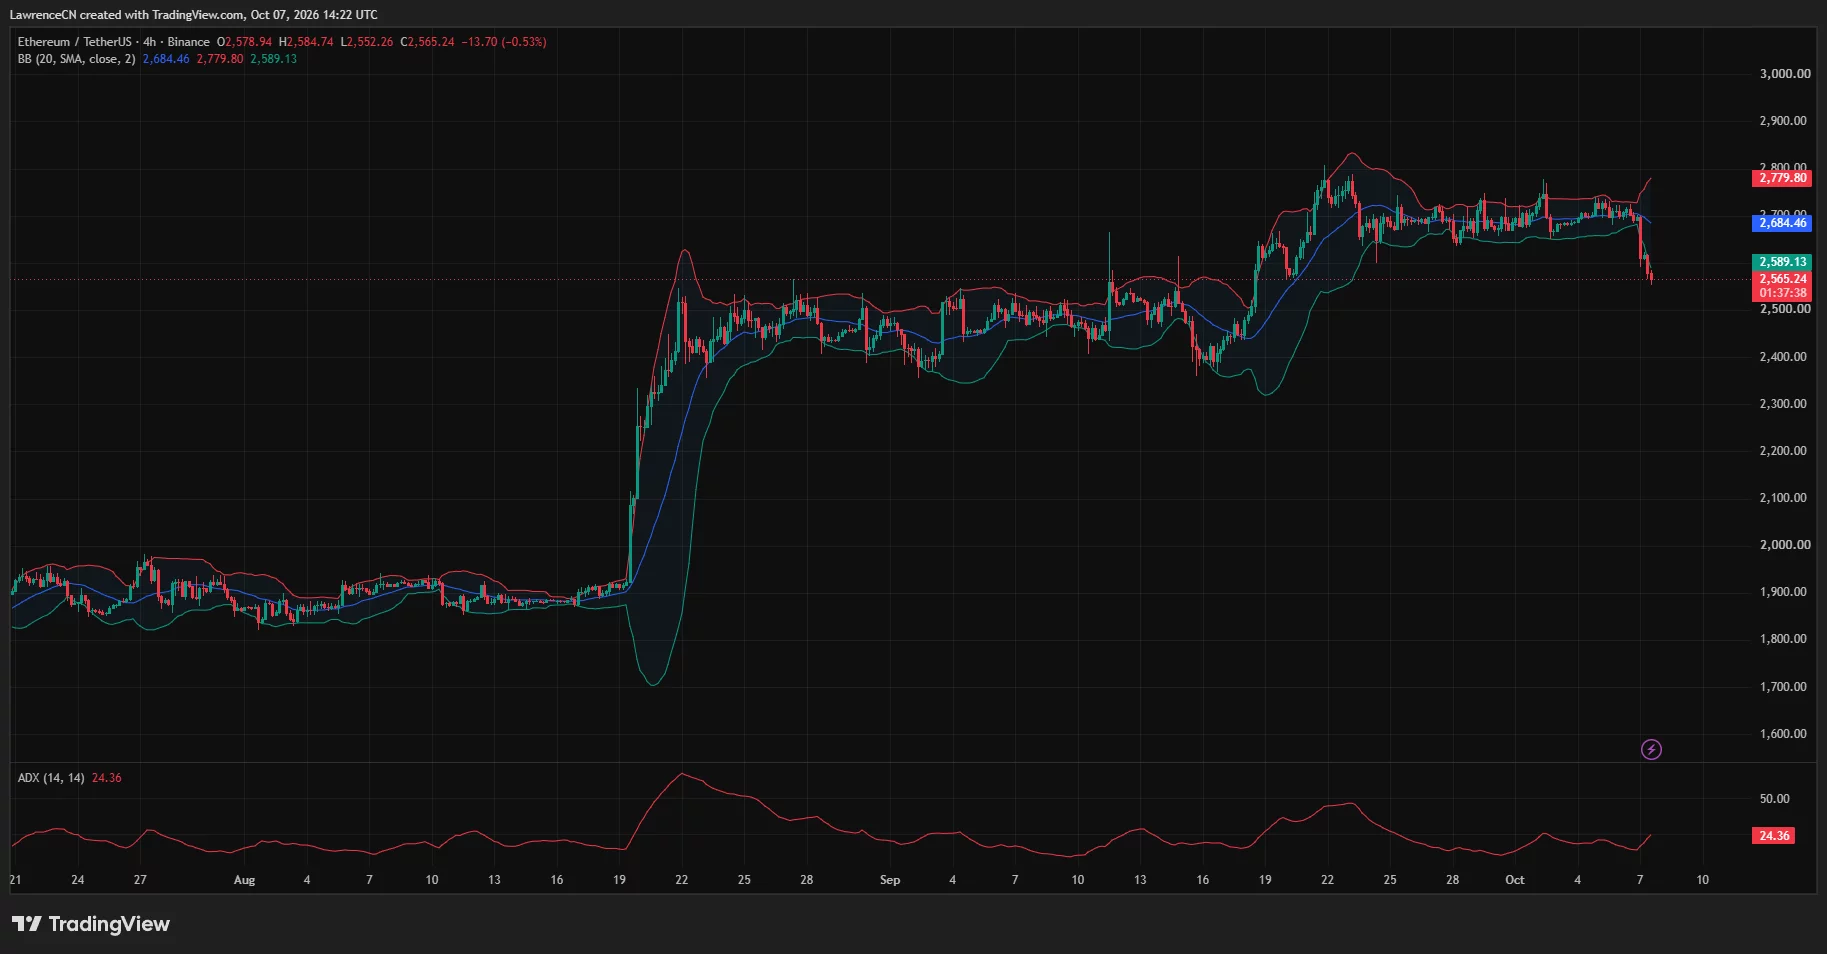
The upper band is near $2,780, making the $2,680-$2,700 region an important level for any recovery attempt. ADX has risen to 24.36, approaching the 25 level commonly associated with a strengthening directional trend.
Analysts watch $2,500-$2,560 as ETH’s next test
Crypto trader Merlijn The Trader identified the current decline as a retest of Ethereum’s earlier triangle breakout and said the $2,500-$2,560 range is the key area to defend.
“Hold $2,500–$2,560 and $3,000 is next.”
His chart places the current pullback near the former breakout area, suggesting the bullish setup remains possible if buyers defend that range. Under the scenario, reclaiming the recent highs could reopen a path toward $3,000, although ETH would first need to recover resistance around $2,680-$2,800.
Analyst Ted Pillows also pointed to Ethereum’s longer-term moving-average structure after ETH touched $2,600. He said the token is approaching its 100-week exponential moving average, making the next weekly close important for the broader trend.
“A weekly close below the 100W EMA could result in a deeper correction.”
The weekly setup therefore adds weight to the $2,500-$2,600 area. Losing the region on a sustained basis could expose ETH to a larger retracement, while defending it would keep the September breakout structure intact.
For now, Ethereum price sits at a technical crossroads. The $2,500-$2,560 zone is the immediate support area to watch, while a recovery above $2,680 would be the first sign that buyers are regaining control. Above that, $2,780-$2,800 remains the main resistance before the $3,000 target discussed by Merlijn comes back into focus.
Disclosure: This article does not represent investment advice. The content and materials featured on this page are for educational purposes only.
